Filament Table as a Report: Show Only Group Summaries with groupsOnly()
2026-04-01 Filament v4/5You have a table with hundreds of rows - orders, transactions, support tickets - and your client says: "I don't need the individual rows. Just show me the totals per category."?
Filament can do this out of the box. Combine table grouping with column summarizers and the groupsOnly() method, and your table turns into a compact report that shows only aggregated data per group.
The Setup
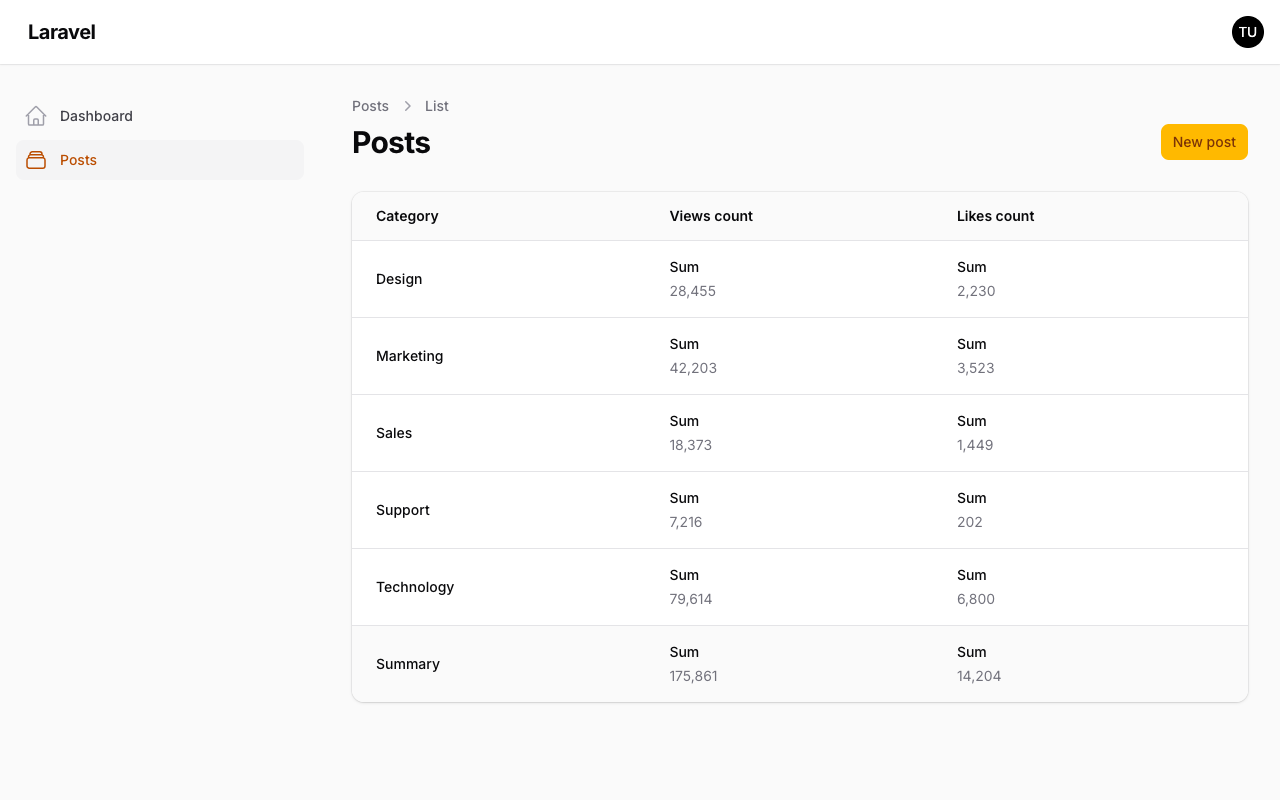
Let's say you have a Post model with category, views_count, and likes_count columns. You want a table that shows total views and likes per category — nothing else.
app/Filament/Resources/Posts/Tables/PostsTable.php
use Filament\Tables\Columns\Summarizers\Sum;use Filament\Tables\Columns\TextColumn;use Filament\Tables\Table; public static function configure(Table $table): Table{ return $table ->columns([ TextColumn::make('category'), TextColumn::make('views_count') ->summarize(Sum::make()), TextColumn::make('likes_count') ->summarize(Sum::make()), ]) ->defaultGroup('category') ->groupsOnly();}That's it. Three key pieces:
->summarize(Sum::make())on each numeric column tells Filament to calculate a sum for every group.->defaultGroup('category')groups rows by thecategorycolumn.->groupsOnly()hides the individual rows entirely, leaving only the summary line per group.
The table is grouped by category because of ->defaultGroup('category'). In this example, the first column also shows that category value, while the remaining columns display their summarized values.
Mixing Multiple Summarizers
You're not limited to one summarizer per column. Stack them to show multiple calculations in the same cell:
use Filament\Tables\Columns\Summarizers\Average;use Filament\Tables\Columns\Summarizers\Range;use Filament\Tables\Columns\Summarizers\Sum;use Filament\Tables\Columns\TextColumn; TextColumn::make('views_count') ->numeric() ->summarize([ Sum::make()->label('Total'), Average::make()->label('Avg'), Range::make()->label('Range'), ])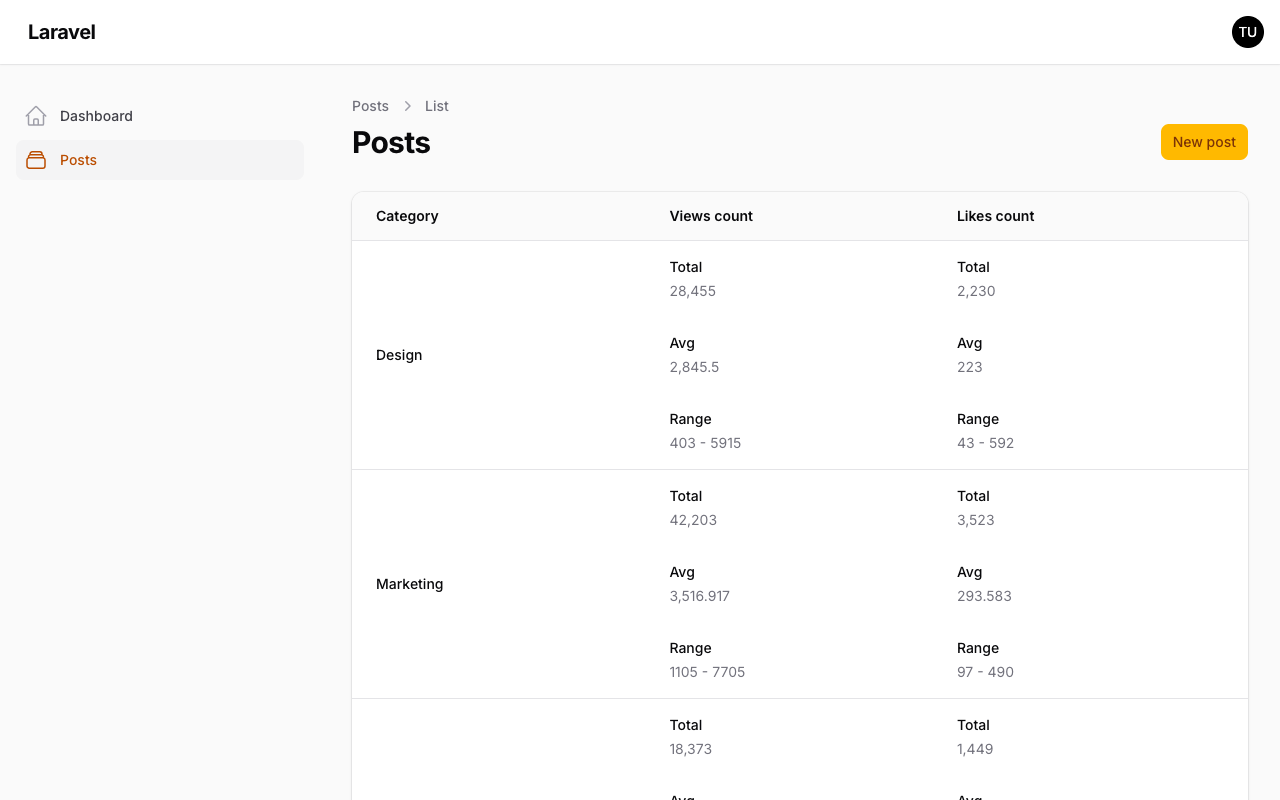
Each summarizer gets its own row inside the group summary. Labels help the reader tell them apart.
Filament ships with four built-in summarizers: Sum, Average, Count, and Range.
Custom Summarizer with a Database Query
Need something the built-ins don't cover? Use Summarizer::make() with a using() callback. You get access to the underlying query builder:
use Filament\Tables\Columns\Summarizers\Summarizer;use Filament\Tables\Columns\TextColumn;use Illuminate\Database\Query\Builder; TextColumn::make('views_count') ->summarize(Summarizer::make() ->label('Median') ->using(function (Builder $query): string { $values = $query->pluck('views_count')->sort()->values(); $count = $values->count(); if ($count === 0) { return '0'; } $middle = intdiv($count, 2); return $count % 2 === 0 ? (string) (($values[$middle - 1] + $values[$middle]) / 2) : (string) $values[$middle]; }))The callback receives a Builder scoped to the current group, so the calculation applies only to the rows within that group.
Controlling the Page vs. Total Summary Rows
By default, when you add summarizers to a non-grouped table, Filament shows a summary for the current page and a total for the entire dataset. With groupsOnly(), Filament already hides the page summary row, but you may still want to remove the overall table summary row as well:
public static function configure(Table $table): Table{ return $table ->columns([ // ... ]) ->defaultGroup('category') ->groupsOnly() ->summaries( pageCondition: false, allTableCondition: false, ); }This leaves only the per-group summaries visible — exactly what a reporting view needs.
When to Use This
This pattern works well for dashboard widgets too. Create a table widget with php artisan make:filament-widget --table and apply the same groupsOnly() approach. You get a lightweight reporting widget without building a custom chart or query.
One thing to keep in mind: the first column in the table cannot have a summarizer. Filament reserves it for rendering the group heading. Structure your columns accordingly — put the group label column first, numeric columns after.
A few of our Premium Examples: