
Filament Dashboard: Data from External API in JSON
Filament 4/5A custom Filament dashboard that transforms the live USGS earthquake feed into statistics, a magnitude chart, and an actionable recent-earthquakes table without storing data locally.
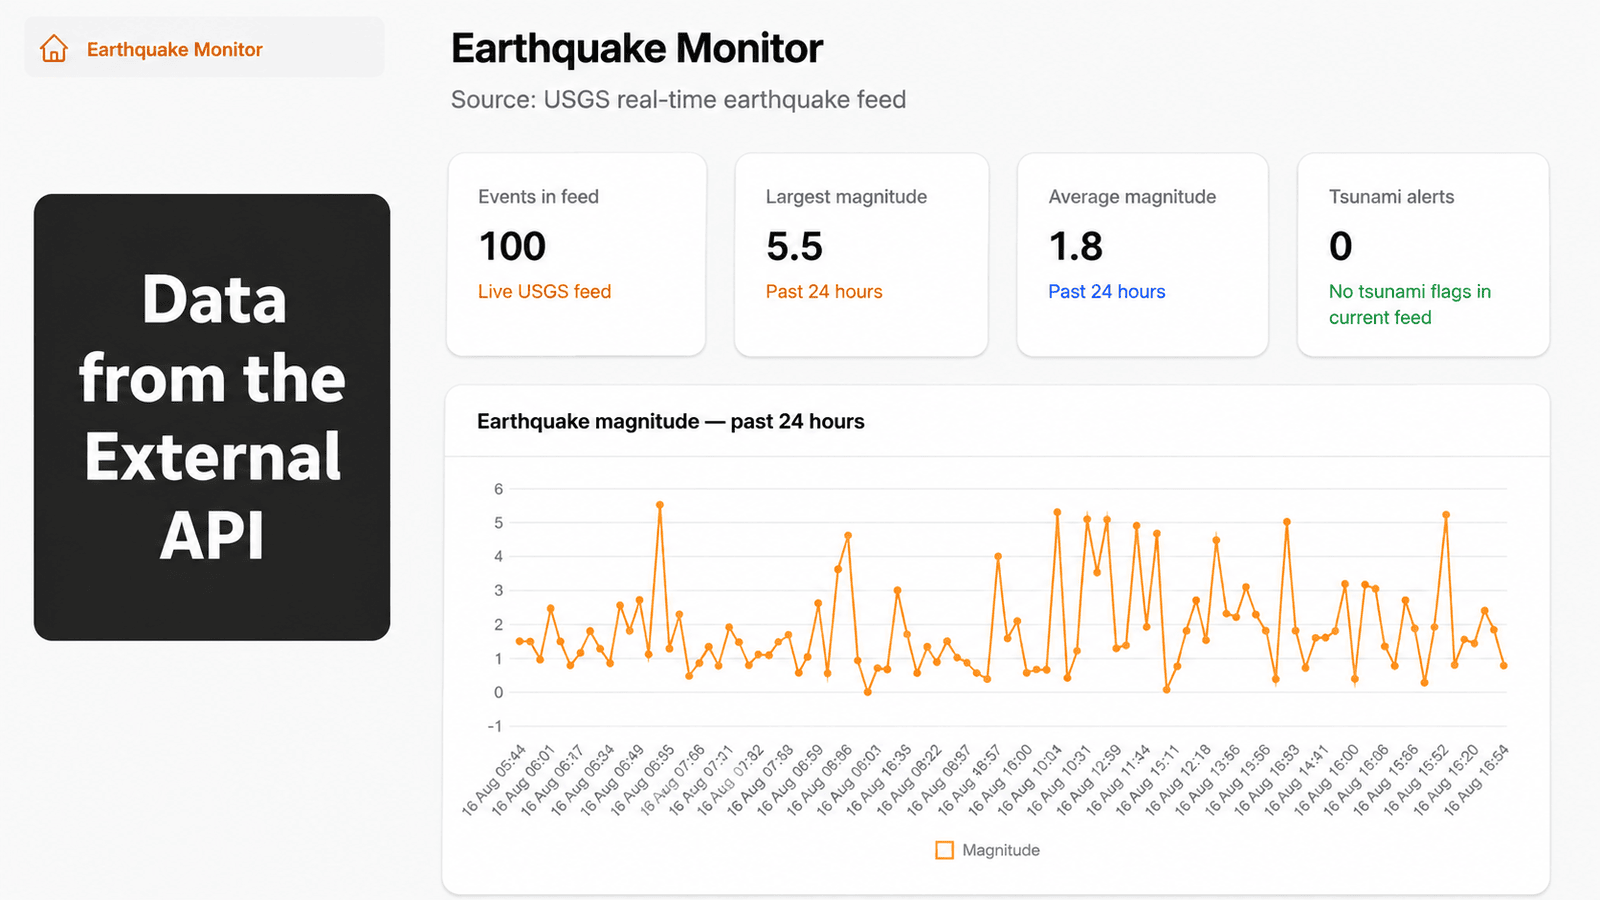
Get the Source Code:
Only This Example
One-time payment
 Sign in with GitHub to buy
Sign in first, then complete your $9 checkout.
FilamentExamples Membership
30-day money-back guarantee
How it works
External API Dashboard
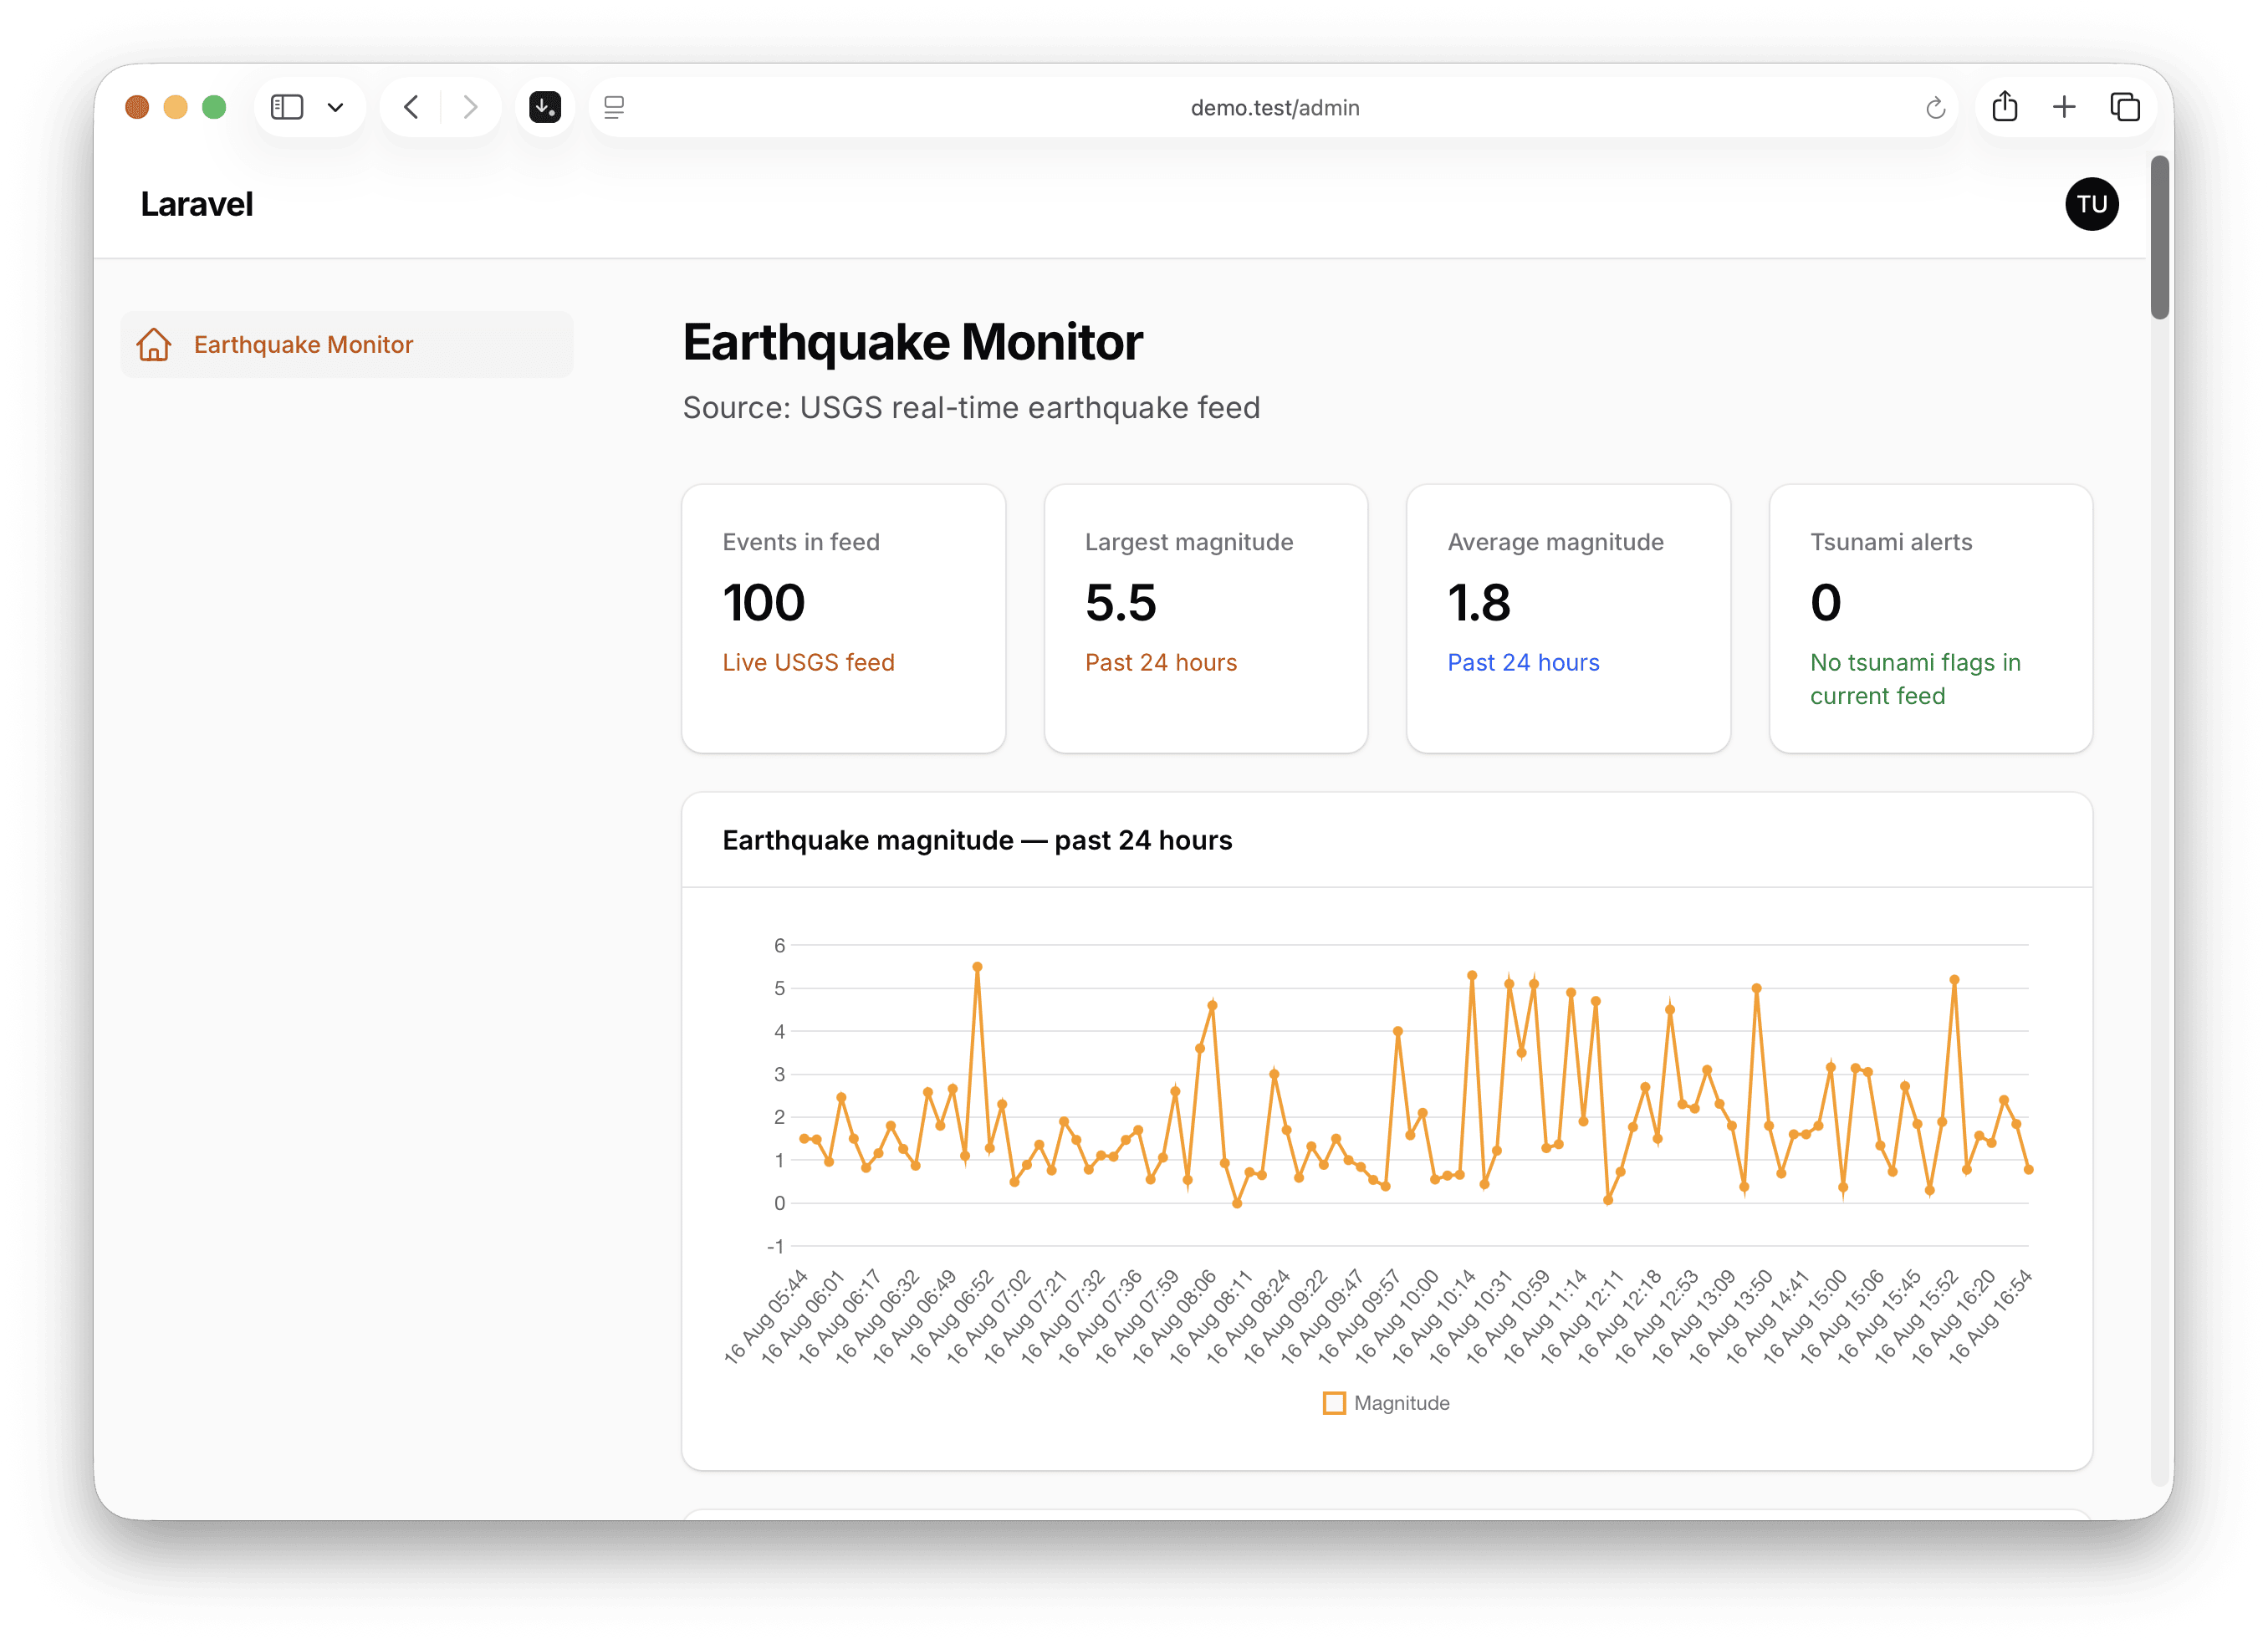
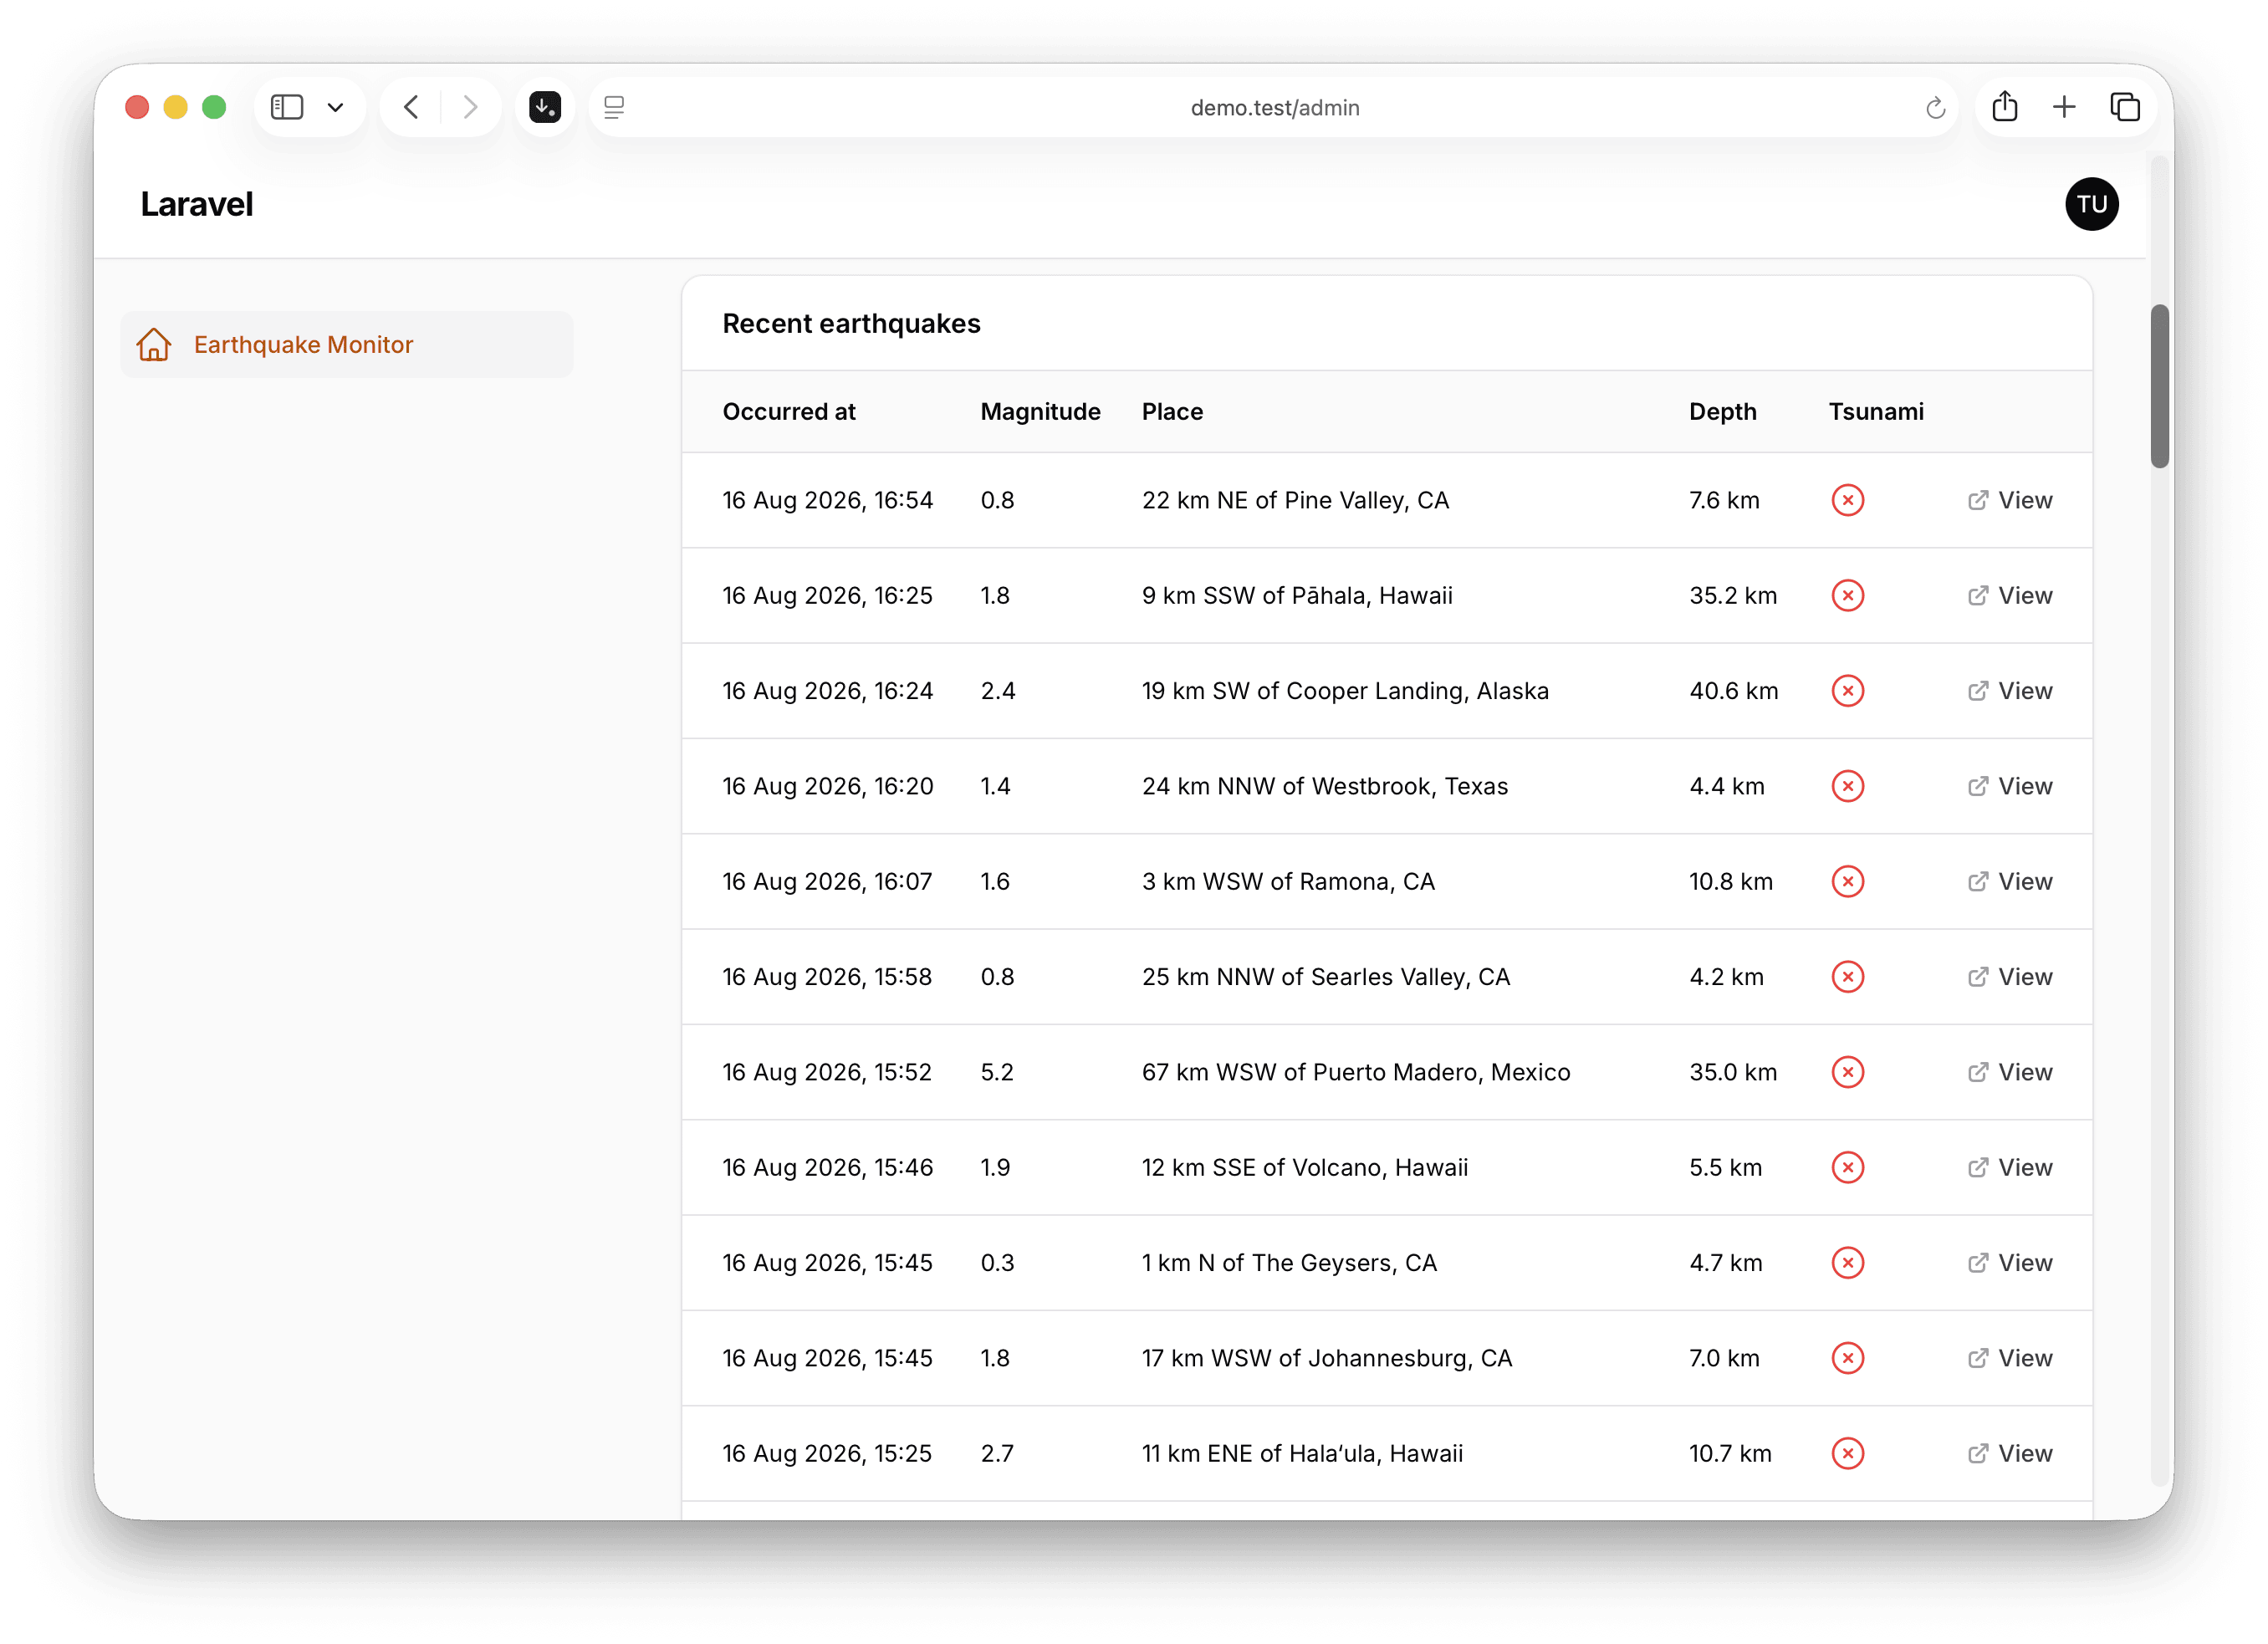
This project demonstrates how to build a custom Filament dashboard powered by an external API instead of Eloquent models. It loads the USGS real-time earthquake feed and turns the latest events into summary statistics, a magnitude chart, and a paginated table with links to the original USGS event pages.
The key idea is that every widget reads from one scoped EarthquakeFeed service. The service fetches and normalizes the GeoJSON response once per request, so the stats, chart, and table can share the same data without making three separate API calls. The dashboard also handles an unavailable feed gracefully instead of breaking the whole panel.
The repository contains the complete Laravel + Filament project to demonstrate the functionality, including a seeded administrator account and tests for the API service and dashboard widgets.
The Filament project is in the app/Filament folder.
Feel free to pick the parts that you actually need in your projects.
How to install
- Clone the repository with
git clone - Copy the
.env.examplefile to.envand edit database credentials there (the default is SQLite) - Run
composer install - Run
php artisan key:generate - Run
php artisan storage:link - Run
php artisan migrate --seed - That's it: launch the URL
/adminand log in with credentials[email protected]andpassword
Screenshots
How It Works
The application is organized around one custom Filament dashboard. The page decides which widgets appear and how they are laid out, while a small service fetches the live data that every widget presents in a different way.
1. Dashboard — Custom Title, Layout, and Widgets
The custom dashboard extends Filament's base dashboard page. It changes the page title and subheading, explicitly returns the three earthquake widgets in display order, and uses a two-column grid. The chart and table set their own column span to full, so only the summary stats use the multi-column layout.
app/Filament/Pages/Dashboard.php
class Dashboard extends BaseDashboard{ protected static ?string $title = 'Earthquake Monitor'; public function getWidgets(): array { return [ EarthquakeStatsOverview::class, EarthquakeMagnitudeChart::class, RecentEarthquakesTable::class, ]; } public function getColumns(): int|array { return 2; } public function getSubheading(): ?string { return 'Source: USGS real-time earthquake feed'; }}The custom page replaces the default dashboard by being registered in the panel provider:
app/Providers/Filament/AdminPanelProvider.php
->pages([ Dashboard::class,])The key points:
- The dashboard owns the widget order, so the stats always appear before the chart and recent-events table
getColumns()creates the two-column page grid, while widgets that need more horizontal space useprotected int|string|array $columnSpan = 'full'- The page title and subheading explain what the dashboard monitors and identify USGS as the data source
- The custom dashboard is registered directly in the panel provider, replacing Filament's default dashboard page
2. EarthquakeFeed — One Normalized API Result
EarthquakeFeed calls the USGS all_day.geojson endpoint with short connection and response timeouts. It validates each feature, converts the millisecond timestamp into a CarbonImmutable instance, extracts coordinates and depth, and limits the result to 100 records. Connection errors, unsuccessful responses, and unexpected payloads become an unavailable EarthquakeFeedResult instead of escaping into the widgets.
app/Services/EarthquakeFeed.php
public function get(): EarthquakeFeedResult{ return $this->result ??= $this->fetch();} private function fetch(): EarthquakeFeedResult{ try { $response = Http::timeout(5) ->connectTimeout(3) ->get(self::ENDPOINT); $response->throw(); } catch (ConnectionException|RequestException $exception) { return EarthquakeFeedResult::unavailable($exception->getMessage()); } // Normalize the USGS GeoJSON features...}The service is registered as scoped, and its get() method memoizes the result. This lets every widget resolve the same service and reuse one API response during the request.