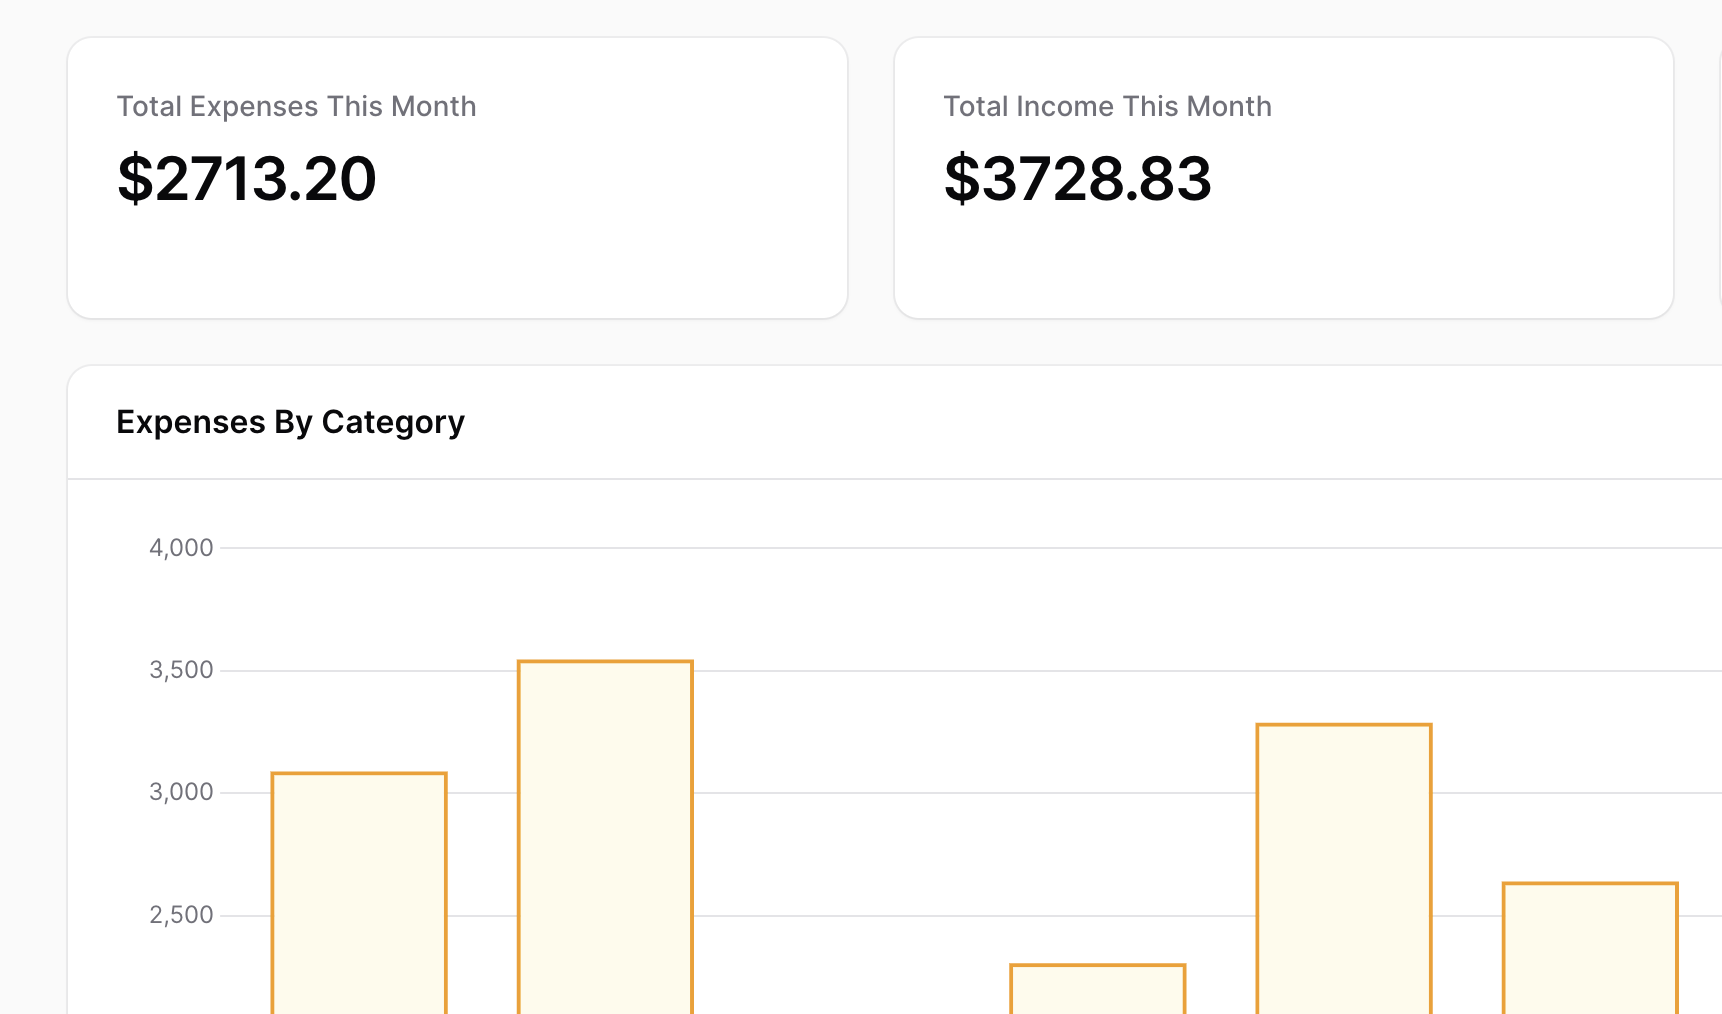
This project demonstrates how to manage expenses/income by categories and shows charts with numbers on the dashboard.
Get the Source Code:
Only This Example
$9
One-time payment
Full source code for Expense Management with Dashboard Charts
Downloadable ZIP file with the source code
Lifetime access to this example
 Sign in with GitHub to buy
Sign in first, then complete your $9 checkout.
Best value — all 174 examples
View membership plans
FilamentExamples Membership
$99
/year
or
$199
lifetime
Access to code of all 174 examples
Future new examples and updates included
FilaCheck Pro package licence included
MCP server included
30-day money-back guarantee
How it works
This example project has two navigation groups:
- Expense
- Income
In these groups, we have Filament Resource to manage expense or income and their categories.
These resources have identical forms and tables. The table is sorted by entry date in descending order.
Here is the code for the expense and income form and table:
public static function form(Form $form): Form{ return $form ->schema([ Forms\Components\DatePicker::make('entry_date') ->required(), Forms\Components\TextInput::make('amount') ->numeric() ->required() ->step('0.01'), Forms\Components\TextInput::make('description') ->columnSpanFull(), ]);} public static function table(Table $table): Table{ return $table ->columns([ Tables\Columns\TextColumn::make('entry_date') ->date(), Tables\Columns\TextColumn::make('amount') ->money(), Tables\Columns\TextColumn::make('incomeCategory.name'), ]) ->filters([ Tables\Filters\TrashedFilter::make(), ]) ->actions([ Tables\Actions\EditAction::make(), ]) ->bulkActions([ Tables\Actions\BulkActionGroup::make([ Tables\Actions\DeleteBulkAction::make(), Tables\Actions\ForceDeleteBulkAction::make(), Tables\Actions\RestoreBulkAction::make(), ]), ]) ->defaultSort('entry_date', 'desc');}And here is the code for...
The FULL tutorial is available after the purchase: in the Readme file of the official
repository you would get invited to.